The problem explored
Bringing database queries, calculated metrics and report delivery into one flow.
A database-to-report pipeline with calculation, AI interpretation and a reporting log. The supplied diagrams document the configured connections, rather than verified production outcomes.
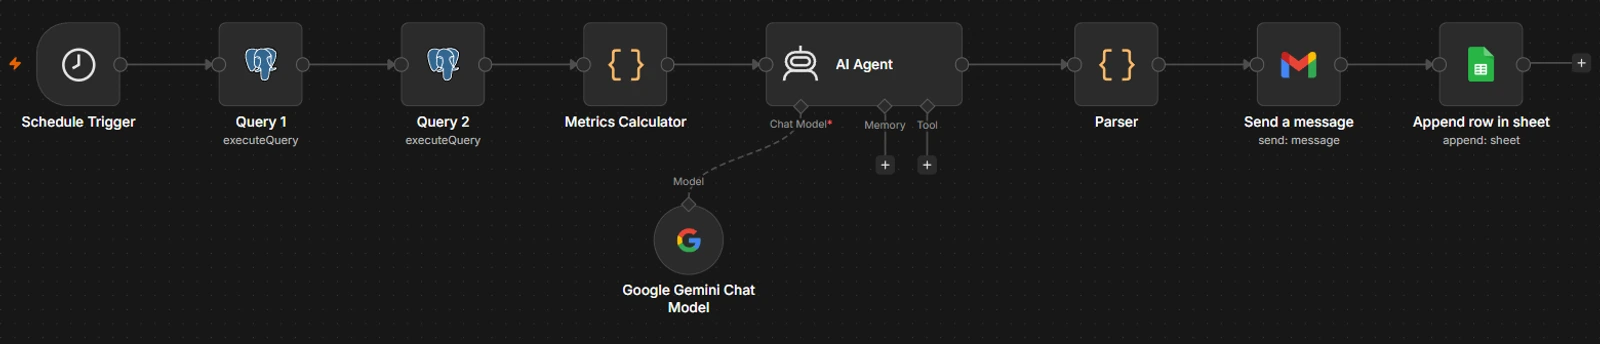
Scroll sideways to inspect the diagram. Zoom enlarges labels; Reset zoom restores this preview.
Architecture summary · read alongside the source
- Query the data
- Calculate metrics
- Prepare the report
- Deliver & log
Inside the processing logic
Query the data
- A Schedule Trigger starts the workflow.
- Two PostgreSQL query nodes run in sequence.
- The query text and database schema are not visible.
Calculate metrics
- A Metrics Calculator code node follows the queries.
- The node name indicates a calculation stage.
- Specific formulas and metric definitions cannot be inferred from the image.
Prepare the report
- An AI Agent connects to a Gemini model.
- A Parser code node follows the agent.
- The screenshot does not expose the report prompt or output format.
Deliver & log
- A Gmail send-message node follows parsing.
- Append Row in Google Sheets is the final visible step.
- The image shows the configured sequence, not delivery results.
Step through the explanation
Dennice, an original illustrated robot guide, walks through the diagram. Start with Next, or choose autoplay. Captions and a full transcript are included; sound is optional.
Source evidence
These are the supplied local files used to write this explanation. Node labels and connections are visible; exported workflow JSON and execution logs were not supplied.
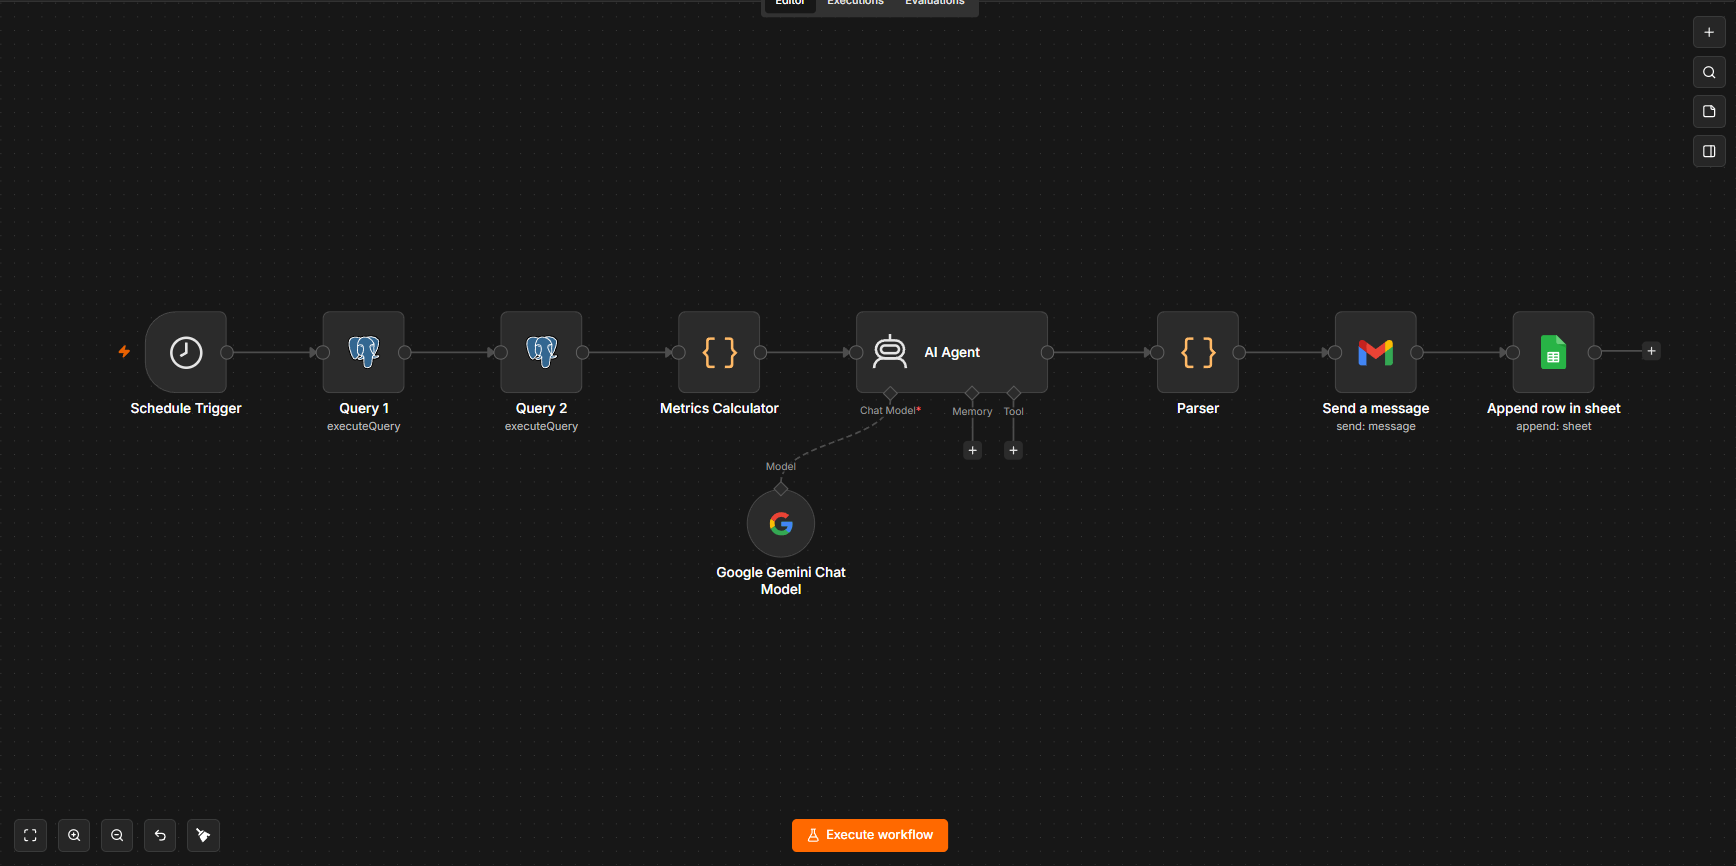
Visible outputs
A Gmail report and a reporting row appended to Google Sheets.
These outputs are represented by nodes in the source. Delivery success and business results require execution evidence.
What this case study does—and doesn't—verify
The case study is grounded in the screenshot's node connections. No revenue figure, reporting accuracy or measured result is claimed. Query correctness and calculation tests remain important pre-use checks.
Next validation steps
Before operational use, I would inspect the workflow export, confirm credentials and permissions, test representative inputs and error paths, and review the outgoing messages with the intended user. These are proposed checks, not completed workflow execution tests.